6/18/02
New Directions for Geometry Standards (10/01/99)
Prepared by:
Joseph Malkevitch
Department of Mathematics and Computing
York College (CUNY)
Jamaica, New York 11451
Email: malkevitch@york.cuny.edu
web page:
http://york.cuny.edu/~malk/
Geometry is perhaps the fastest growing branch of mathematics. Driven by developments in computer graphics, operations research, robotics, and communications technology, as well as many other areas, new applications and ideas are rapidly emerging. Traditional topics in geometry require augmentation with ideas from the theory of graphs, discrete geometry, and convexity to show the full range of tools that mathematics makes available to problem solvers.
Construction of graph models
Examples:
1. Given a table of workers and jobs they are qualified for, draw a geometric diagram which can be used to display the same information.
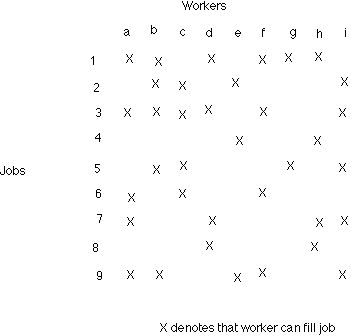
Comment: This type of activity supports the same goals as using visual displays (pie charts, histograms, etc.) to display data in frequency distribution tables.
What is the largest number of workers that can be assigned to jobs for which they are qualified?
2. Given a table of workers and jobs, which gives for each job-worker pair where the worker is qualified for the job, two (integer) numbers. The first number is the amount of time (in minutes) that the worker needs to complete the job. The second number gives the quality rating for the worker at that job.
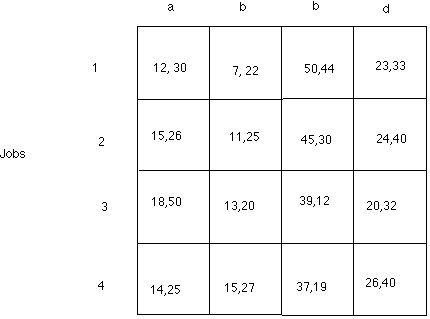
Problem: Study how to assign workers to jobs so that the total time needed for the workers to finish the jobs is as small as possible. Study how to assign workers to jobs so that the total of quality points is as large as possible. What might be done if the two solutions look very different?
Comment: Problems of this kind in lower grades allow students to practice arithmetic (additions, conversion between time units, etc.) in a meaningful way. It also encourages logical thinking and keeping straight different numbers that are important but should not be confused.
3. Given the piece of a woven basket (or fabric with wide strands) draw a graph which represents which strands go over and under the other. If the warp (vertical) strands are red and the weft (horizontal) strands are green, how many cells look green from the top of the fabric and how many look red from the top of the fabric? How many green and red cells does one see on the back side of the fabric? Experiment with designing fabrics that equalize the number of colored cells in the front? Does equalizing the number of colored cells in the front equalize the number of color cells in the back?
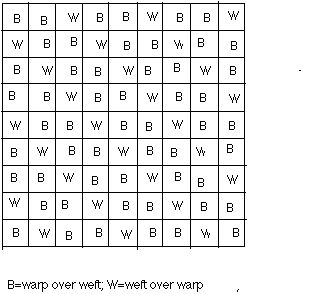
Do you need a table this large to determine the nature of the pattern if the pattern was obtained by replicating this block in both the vertical and horizontal directions?
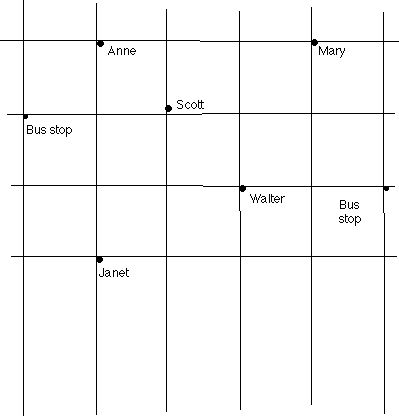
4. The diagram below shows a portion of a neighborhood, indicating the students in this area who are in the same class. A teacher gives an assignment which requires that students work together but it would not be practical for students to do this if they live more than 3 blocks from each other. Which students live within three blocks of Mary? Scott? Walter? Draw a graph which shows which students live exactly one block apart. Draw a graph which shows which students live exactly two blocks apart. Draw a graph which shows which students live at most three blocks apart.
5. Draw (separate) graphs which display the information for the collection of students in a student's class, which students were born in the same month, which students were born in the same year, which students live on the same street, which students have a sister, and which students have a brother.
6. Given the list of preference schedules below which arose from ranking 5 types of soft drinks to be served at the 5th grade picnic, draw a diagram that shows which drink would win in each two-way race in which two drinks were compared to see which had more support.
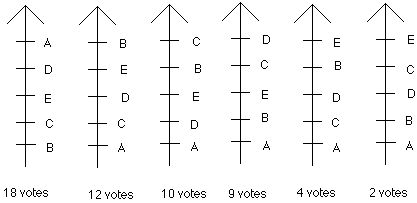
For example, the fact that 39 students prefer C to B and 16 voters prefer B to C could be coded in a diagram with 5 dots, one for each type of soft drink by drawing an arrow from C to B.
Geometry and computer graphics
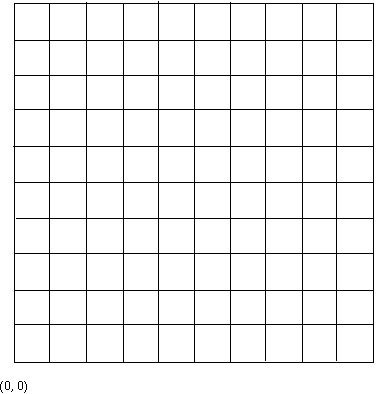
Given the collection of cells that represent pixels of a calculator (or computer screen), which cells should be lit up to display the line: y = 3x+1? Compare the graph you get with the usual graph of the line y = 3x+1. Extend this problem to other simple graphs such as a circle.
Conflict resolution
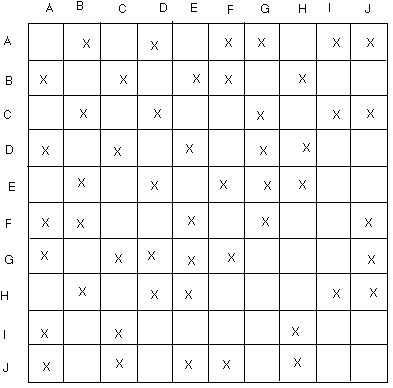
The table below shows different species of fish which, if placed in the same tank, will attack one another. Draw a diagram which represents the conflict information in this table. What is the minimum number of tanks the fish can be displayed in so that no fish in a particular tank will attack each other? Can this condition be met with equal numbers of fish in each tank? If not, how close can you get to equalizing the number of fish in each tank?
Names of shapes and dimension
Take a letter size envelope and seal it. Fold the envelope along the diagonals and use scissors to cut out the triangle formed along the top of the envelop.
Flex the remaining paper so that the flap at A fits into the flap at B.
What is the name of the three-dimensional shape that results? How many vertices, edges, and faces does this shape have? How many sides does each face of the shape have?
Making new shapes from old shapes
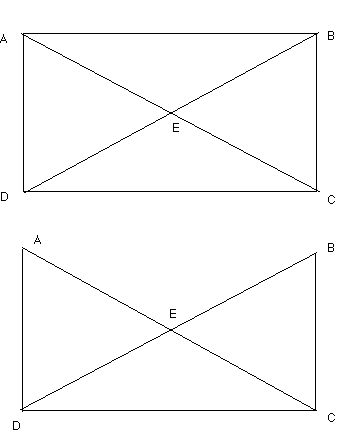
Start with a rectangle which is, say, 3 units by 15 units. What is the area of the rectangle? What is the perimeter of the rectangle? What is the volume of the rectangle?
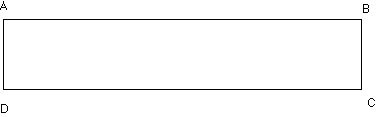
a. Take the rectangle and paste the edge AD to the edge BC. What is the name of the shape that results? Does it make sense to discuss the area, perimeter, and volume of the result?
b. Take the rectangle and paste the edge AD to the edge BC after giving it a half-twist. What is the name of the shape that results? Does it make sense to discuss the area, perimeter, and volume of the result?
Take the shapes that result from activities a. and b. and cut them down the middle. Compare the results.
Scheduling
The operations director of a commuter airline has listed tasks and the times that they take before a plane that has just reached the gate can be turned around to return to the city it came from. In the table listing the tasks is also displayed which tasks must immediately precede others. For example, before new passengers can be loaded, the arriving passengers must be deplaned. You may or may not agree with the chart that the operations director produced but use this chart to construct a geometric diagram showing which tasks must precede others and use this diagram to determine the minimum time in which the plane can be turned around.
Task Time (in minutes) Immediate Predecessors
Unload Freight 25 None
Load New Freight 16 Unload Freight
Unload Passengers 14 None
Safety Check 2 Unload Passengers
Load New Passengers 20 Safety Check, Clean Cabin
Clean Cabin 12 Safety Check
Take on Food 4 Clean Cabin
Refuel 18 None
Sports
The PTA of a small town sponsors a second grade soccer league, with games on Sunday afternoons. There are six teams, and there are three playing fields at the middle school where the games can be played. How many weeks are required for a schedule in which each team plays every other team exactly once? Which teams can be scheduled against each other on each Sunday to guarantee that the tournament is completed in the minimal number of weeks?
At the end of the season the results of the tournament are as follows:
Team Won Lost Beat
A 4 1 B, C, D, E
B 3 2 F, E, D
C 4 1 B, D, E, F
D 1 4 F
E 1 4 D
F 1 4 A
If the Chamber of Commerce has promised prizes for the four best teams in the league, which teams deserve the prize? (Can drawing a diagram to display the results of the tournament help in answering the question?)
Vision geometry
Motion detectors are to be placed at the base of the vertical walls which are corners of an art museum, as a way during hours that the museum is closed of helping with security. For a museum with the floor plan below (the corners are the dark dots), what is the minimum number of motion detectors necessary to secure all the floor space of the museum? (It is assumed that a motion detector beam is effective at a point in the museum where a line joining this point to a detector does not penetrate a wall.)
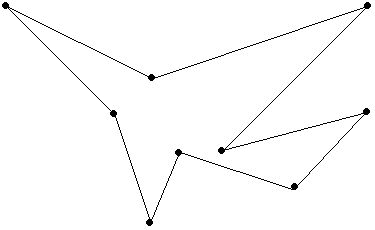
The museum shown has nine walls. Is there some number of detectors that would make it possible to guard any design of museum with 9 walls?
Can you find a formula which tells one for a museum with n walls what would be the number of motion detectors which are needed for some museum with n walls, but would work for any museum with n walls?
Rollers
It is possible to use rollers with circular cross-sections to move objects at a constant level above a straight line road. Are there other shapes one could use as cross-sections with which one could achieve this goal?
It is worth noting that symbolic algebra packages now do a wide variety of algebraic and computational tasks as well as highly trained humans. (For example, formal integration is a difficult skill for humans and yet MAPLE will integrate very complex integrals accurately, and certainly more quickly than most humans. However, getting a computer program to do simple geometric problems, at the current time, is extremely difficult.
Acknowledgement
This work was prepared with partial support from the National Science Foundation (Grant Number: DUE 9555401) to the Long Island Consortium for Interconnected Learning (administered by SUNY at Stony Brook).
#
Return to Joseph Malkevitch's home page